Gut health gets all the attention. But if you take a daily prebiotic, you might wonder: what’s the footprint behind that scoop of powder? Here’s the practical answer-where the biggest impacts actually sit (farming, processing, packaging, shipping), when food beats supplements, and how to pick lower-impact products without getting lost in green claims.
- TL;DR: Most plant-based prebiotics (chicory inulin, FOS, resistant dextrin) have modest footprints per kilogram; upcycled sources (corncob XOS) tend to be lowest. Dairy-based GOS is usually higher.
- Packaging and air freight can erase ingredient gains. Choose bulk pouches, avoid single-serve sticks, and buy products shipped by sea/road.
- Your best move: fiber-rich foods first; supplements fill gaps. Look for upcycled feedstocks, credible LCAs, and third-party sustainability schemes.
- Rule of thumb: If the source is a byproduct/waste stream and the brand publishes a cradle-to-gate LCA, you’re likely looking at a better choice.
- Quick audit: Ingredient source → processing energy → packaging per dose → transport mode → disposal. Small tweaks here beat offsets.
What prebiotics are (and why origin matters)
When labels say prebiotic, they usually mean specific fibers that feed beneficial gut microbes. The big ones you’ll see:
- Inulin/oligofructose (from chicory root, Jerusalem artichoke, or agave)
- Fructo-oligosaccharides (FOS) made enzymatically from sucrose (cane or beet)
- Galacto-oligosaccharides (GOS) made from lactose (whey permeate)
- Xylo-oligosaccharides (XOS) hydrolyzed from corn cobs, sugarcane bagasse, or wood hemicellulose
- Resistant dextrin (from corn or wheat starch), partially hydrolyzed guar gum, and psyllium husk
Not all grams of fiber are equal for the planet. The footprint swings with three things:
- Feedstock: Is it a primary crop (e.g., sugarcane), a byproduct (whey), or upcycled waste (corn cobs)? Upcycled inputs usually win.
- Processing: Enzymes and spray-drying need heat and electricity. Energy mix matters. Natural gas and coal vs. renewables is a big lever.
- Allocation: If an ingredient comes from a system with multiple products (milk → cheese + whey), the LCA must allocate impacts. Different allocation rules can double or halve the number.
To keep comparisons fair, look for cradle-to-gate LCAs (farming to factory gate) using ISO 14040/44. Most credible studies report greenhouse gas emissions (kg CO₂e per kg product), water use, and land/biodiversity indicators. Recent LCAs of chicory inulin in the EU and FOS from sugar beet show that farming and drying dominate; XOS from upcycled biomass tends to be lower because the feedstock is essentially “free” of farming impacts under many allocation methods. GOS is trickier: it inherits some dairy emissions unless the LCA allocates most impacts to cheese.
One more reality check: dose matters. A typical supplement serving is 3-5 g/day. Even a higher footprint per kg can be small per serving. But if your routine involves heavy packaging or air-freighted imports, that per-dose advantage can evaporate fast.
The footprint, broken down (farming → processing → packaging → transport → end-of-life)
Here’s how the emissions and resource use stack up, based on recent life-cycle assessments (2018-2024), industry environmental product declarations, and standard logistics factors:
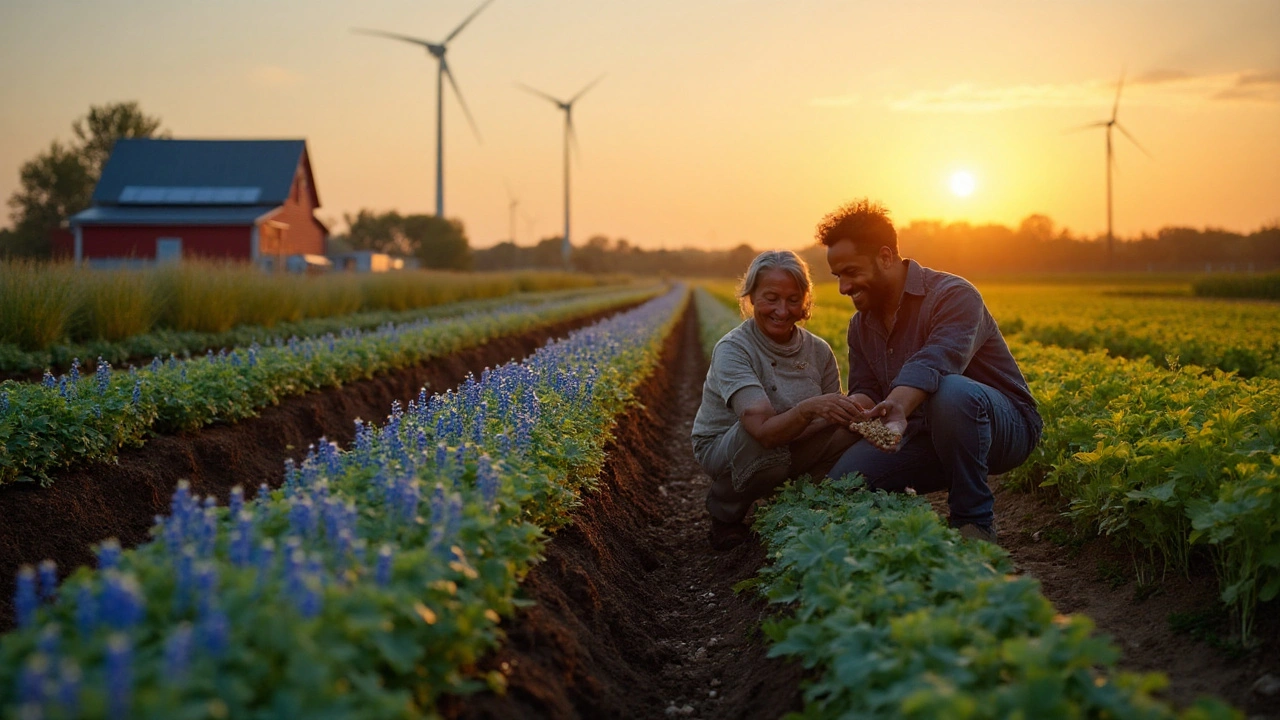
- Farming: Fertilizer and field emissions dominate for chicory, sugarcane, and corn starch. Drip-irrigated cane in wet regions fares better than irrigated cane in dry areas. Chicory in Northwestern Europe often benefits from efficient rotations.
- Processing: Enzymatic conversion, filtration, and spray-drying drive energy use. Switching to renewable heat and high-solids spray-drying cuts this segment 20-40% in some plants.
- Packaging: Single-serve sticks can add 2-4× more packaging per dose than bulk pouches. Recyclability isn’t a guarantee-actual recycling rates for flexible plastic are still low.
- Transport: Sea freight is ~30-50× less carbon intensive than air by weight-distance. Regional sourcing can trim transport to rounding error.
- End-of-life: Paper pouches with thin liners tend to have lower impacts than rigid plastic tubs. Compostable films help, but only if you have access to industrial composting.
The ranges below come from cradle-to-gate LCAs and reputable databases (e.g., Ecoinvent; peer-reviewed LCAs for chicory inulin, beet/cane FOS, whey-derived GOS, and upcycled XOS). Values vary with energy mix, allocation, yield, and plant design. Use them as ballpark numbers, not absolutes.
| Prebiotic/Source | Typical feedstock | GHG (kg CO₂e/kg) | Water risk | Notes |
|---|---|---|---|---|
| Inulin/oligofructose | Chicory root (EU/US) | 1.5-3.0 | Moderate | Farming and spray-drying drive impacts; EU LCAs show decarbonized heat reduces top end. |
| FOS | Sugar beet (EU) or cane (BR/TH) | 1.0-2.2 | Variable | Beet in temperate zones often lower water stress; cane depends on region/irrigation. |
| GOS | Lactose from whey | 3.0-8.0 | Moderate | Allocation to whey is the swing factor; dairy methane inflates numbers under economic allocation. |
| XOS | Corn cobs/bagasse (upcycled) | 0.6-1.6 | Low | Low farming burden; processing energy dominates; good choice if powered by renewables. |
| Resistant dextrin | Corn/wheat starch | 0.8-1.6 | Moderate | Thermal/acid processing + drying; footprint tracks starch and energy mix. |
| Psyllium husk | Plantago ovata (IN) | 1.5-3.5 | Variable | Sun-drying helps; long-distance shipping adds if air-freighted during shortages. |
| Food sources (per 5 g fiber) | Oats, beans, greens | 0.05-0.3 | Low-Mod | Cooking at home, minimal packaging; depends on farm practices and seasonality. |
Water and biodiversity aren’t afterthoughts. Sugarcane in water-stressed regions can be a problem if irrigation is heavy. Beet often does better on water but can have fertilizer runoff issues. Chicory is usually rain-fed in Europe and can fit into rotations that help soil health. Upcycled feedstocks (corn cobs, bagasse) avoid new land; that’s a strong nature-positive signal if the plant also treats wastewater and recovers heat.
Transport math you can do on a napkin: air freight averages ~0.6 kg CO₂ per tonne-km; container sea freight often sits near 0.02 kg CO₂ per tonne-km. A 300 g tub flown 8,000 km: 0.0003 t × 8,000 × 0.6 ≈ 1.44 kg CO₂. The same by sea: ≈ 0.05 kg CO₂. One switch, ~30× difference.
Packaging often blindsides people. A month of single-serve sticks (30 × 5 g) can use ~45-60 g of multi-layer film. A 300 g paper-based pouch with PE liner might weigh 20-35 g. That’s 2-3× less packaging per gram, with a better end-of-life path in many places.
Credibility check: reliable claims reference ISO 14067/PAS 2050 methods and name their third-party verifier. Offsets don’t make a product low-impact; they just compensate. Reductions (renewable heat, waste-heat recovery, electrification) move the needle for real.
How to pick a lower-impact prebiotic (fast audit, heuristics, and a buyer’s checklist)
Start with a 5-minute audit you can do from your couch. You don’t need to be a life-cycle expert to avoid the worst offenders.
- Identify the ingredient and source: inulin (chicory), FOS (cane or beet), GOS (dairy), XOS (corncob/bagasse), psyllium, etc.
- Scan for the feedstock story: upcycled/byproduct beats dedicated crops; look for “from corn cobs” or “from whey permeate.”
- Check the processing transparency: any mention of renewable energy, heat recovery, or verified LCA? Bonus if they state the factory location and energy mix.
- Look at packaging per dose: bulk pouch > rigid tub > single-serve sticks. Paper pouch with a thin liner beats multi-layer plastic.
- Assess transport: made on your continent? Shipped by sea? Avoid brands that rush-ship internationally by air.
- End-of-life: can you recycle or compost where you live? If not, choose the lighter option to begin with.
Handy heuristics:
- If it uses a waste stream (XOS from cobs, FOS from beet molasses, dextrin from starch sidestreams), it usually has a lower footprint.
- FOS or inulin from temperate crops with efficient plants tends to beat GOS on carbon unless the dairy allocation is unusually favorable.
- Packaging can add 5-30% to the total footprint for small formats; pick the largest size you’ll realistically finish within shelf life.
- Air freight can exceed the ingredient’s cradle-to-gate footprint for light products. Ask customer support how they ship intercontinentally.
- Food-first: if a breakfast bowl with oats, beans, and greens gets you 10-20 g fiber, your supplement dose (and footprint) can be smaller.
What to look for on labels and websites:
- Clear ingredient origin (e.g., “EU-grown chicory,” “XOS from corn cobs”). Vague = red flag.
- An independent LCA summary (methods stated: ISO 14040/44 or ISO 14067) and the system boundary (cradle-to-gate or cradle-to-grave).
- Certifications relevant to the feedstock: Bonsucro (cane), EU organic/Regenerative Organic (chicory/beet), ISCC PLUS for circular feedstocks, and credible carbon disclosure (third-party verified).
- Packaging details: material, recyclability, grams of packaging per 100 g product, refill options.
- Transport policy: no routine air freight; regional production where possible.
Quick decision tree:
- Need a prebiotic at all? If your daily fiber is under 25-38 g and you’re not tolerating high-fiber foods, a supplement can help while you adjust your diet.
- Prefer plant-based? Choose inulin/FOS/XOS/dextrin over GOS.
- Want the lowest footprint? XOS from upcycled biomass or FOS from beet/cane in efficient plants, in bulk paper pouches.
- Sensitive gut? Start with inulin/FOS in small doses; if gas/bloating hits, try partially hydrolyzed guar or GOS (note: dairy-derived) or go food-first.
- Buying global? Pick brands that make on your continent and ship by sea. Avoid air-shipped “limited drops.”
Back-of-the-envelope carbon for your jar (example):
- Ingredient: Inulin ~2.0 kg CO₂e/kg × 0.3 kg = 0.6 kg CO₂e
- Packaging: Paper pouch 0.03 kg CO₂e
- Transport: Sea 8,000 km → ~0.05 kg CO₂e
- Total ≈ 0.68 kg CO₂e per 300 g (about 60 servings), ≈ 0.011 kg CO₂e per serving
That’s tiny per serving-but it can double with single-serve sticks and air freight. The easy win is obvious.
Food vs supplements, edge cases, and what’s next
Food beats powders most of the time for impact per gram of usable fiber, especially when you cook at home and buy seasonal or regional produce. Dry beans, oats, barley, garlic, onions, leeks, bananas, and asparagus deliver fermentable fibers and inulin-type fructans with minimal packaging. A 2023 analysis of household diets in Europe showed that shifting 10 g/day of fiber from packaged snacks to whole foods cut diet-related emissions more than adding most supplements. You still might want a prebiotic if you’re traveling, need precise dosing, or you’re working with a clinician on specific gut issues.
Edge cases to think about:
- GOS: effective for some gut issues but likely higher carbon because of dairy. If you’re vegan or carbon-focused, lean toward plant-based options.
- Psyllium: helpful for bowel regularity, but supply volatility can push brands to air freight. Buy from brands with stable, planned sea logistics.
- Agave inulin: tasty and soluble; watch for water stress in dry regions and transport distance. Prefer producers that publish water stewardship data.
- Precision fermentation: early-stage for prebiotics. If powered by clean electricity and fed on waste sugars, it could undercut farming impacts; if not, it may simply relocate emissions to the grid.
- Blends: If the first ingredient is flavor, not fiber, you’re paying (and emitting) for additives and packaging. Choose higher fiber concentration per serving.
Future signals worth tracking in 2025:
- Decarbonized heat: more plants are moving to biomass, electric boilers, and heat pumps; expect 15-40% processing emissions cuts where grids are clean.
- Upcycling standards: clearer rules on how to allocate impacts to waste streams will make XOS claims more comparable across brands.
- Carbon labels: retailer pressure in the EU and UK is pushing suppliers to publish verified footprints. Look for numbers, not badges.
- Regenerative sourcing: chicory and beet growers piloting cover crops and reduced tillage could lower nitrous oxide emissions and improve soil carbon.
prebiotics sustainability gets real when brands show their homework: feedstock origin, energy sources, verified numbers, and packaging mass per serving. Anything less is marketing fog.
Mini‑FAQ
Do LCAs compare across brands? Only if the boundary, allocation, and data quality match. Look for ISO 14040/44 methods, recent data (past 5 years), and third-party review. If one brand uses market-average electricity and another uses plant-specific renewable PPAs, the latter usually wins.
Is organic always lower impact? Not automatically. Organic can improve soil and biodiversity, but yields can be lower, which can raise per‑kg emissions. Check the LCA and the energy used in processing.
What about “carbon neutral” labels? Often offsets. Ask what the gross (pre‑offset) footprint is and what direct reductions the company achieved at the plant.
Is local always better? Usually, but not if the local plant runs on coal and the distant plant runs on renewables and ships by sea. Energy mix beats distance more often than you’d think.
Do compostable pouches help? They can, but only if you have access to industrial composting. If you don’t, lighter recyclable paper/PE or mono‑material plastic may be better than multi‑layer “compostable” that ends up in landfill.
Next steps / Troubleshooting
- If you’re a beginner: pick a plant-based prebiotic in a paper pouch from a regional brand that says “shipped by sea/road,” start at 2-3 g/day, and scale up.
- If you’re sensitive: try partially hydrolyzed guar or small-dose inulin; spread your dose across the day; pair with meals. If symptoms persist, talk to a clinician and pivot to food-first.
- If you’re buying for a clinic or team: ask suppliers for verified cradle-to-gate LCAs, energy mix disclosures, and packaging mass per 100 g. Favor upcycled feedstocks and refill formats.
- If you’re comparing two products: use the napkin math-ingredient CF × jar weight + packaging + transport (sea vs air). Eliminate air-shipped sticks immediately.
- If you can’t find sustainability info: email support with five questions-feedstock, plant location, energy mix, LCA verification, packaging weight. No answer? Switch brands.
Sources used in this analysis include peer‑reviewed LCAs (2018-2024) on chicory inulin (EU), FOS from beet/cane, GOS from whey, and XOS from upcycled biomass; FAO reports on crop water use; IPCC emissions factors; and logistics emission intensities for air and sea freight. These sources converge on the same message: choose upcycled feedstocks, low‑carbon energy, bulk packaging, and slow shipping. That’s the low‑effort, high‑impact play.
Boston Farm to School
September 2, 2025 AT 16:30Nice rundown – thanks for the info! 😊
Emily Collier
September 2, 2025 AT 16:43The breakdown of GHG emissions per kilogram really highlights why upcycled feedstocks like XOS are advantageous. By allocating the environmental burden to the primary product, we see a substantial reduction in the per‑serving carbon footprint. It’s also worth noting that renewable energy in processing plants can cut emissions by up to 40 percent, according to recent case studies. When evaluating a supplement, I always suggest checking for third‑party verified LCAs that cite ISO 14040/44 standards. Brands that transparently share their energy mix and packaging mass per dose tend to be more trustworthy. In short, look for clear origin labeling, renewable processing, and minimal packaging to make the most sustainable choice.
Catherine Zeigler
September 2, 2025 AT 16:56I completely agree that the easiest win for most of us is to shift the focus from packaged powders to whole‑food sources of prebiotic fiber. When you consider that a cup of cooked beans or a serving of oats delivers roughly the same amount of fermentable fiber with a fraction of the packaging, the environmental logic becomes crystal clear. Moreover, the water footprint of legumes is typically lower than that of sugarcane‑derived FOS, especially when the legumes are rain‑fed and integrated into crop rotations that improve soil health. Another point to keep in mind is that many manufacturers still rely on air freight for niche products, which can easily eclipse the carbon advantage you might gain from a low‑impact ingredient. Choosing bulk paper pouches over single‑serve sticks not only reduces plastic waste but also cuts the per‑dose emissions by a substantial margin. If you’re in the market for a supplement, prioritize those that disclose the exact grams of packaging per 100 g of product and that commit to sea or road transport as the default shipping method. Upcycled feedstocks, such as XOS derived from corn cobs, are especially compelling because they divert agricultural waste streams that would otherwise require disposal, thereby lowering the overall life‑cycle impact. It’s also encouraging to see a growing number of brands obtaining third‑party verification for their LCAs, which adds a layer of credibility beyond marketing hype. When those LCAs are recent (within the past five years) and include clear system boundaries (cradle‑to‑gate or cradle‑to‑grave), you can have greater confidence in the reported numbers. For those of us who are sensitive to gastrointestinal discomfort, starting with low‑dose inulin or partially hydrolyzed guar can help the microbiome adapt before scaling up the intake. Finally, remember that the carbon intensity of the local electricity grid can be a hidden multiplier in processing emissions; therefore, facilities powered by renewable energy sources provide an additional environmental benefit that is often overlooked. All these considerations together form a practical checklist that empowers consumers to make smarter, lower‑impact choices without sacrificing gut health.
henry leathem
September 2, 2025 AT 17:10While the article paints a rosily simplistic picture, it neglects the systemic entropy introduced by scaling up niche upcycled feedstocks. The marginal gains in GHG reductions are often offset by hidden externalities such as increased demand for high‑intensity enzymatic reactors, which consume copious amounts of electricity-frequently sourced from fossil grids in developing regions. Furthermore, the jargon around "allocation methods" can be a smokescreen; economic allocation frequently dilutes the true burden onto the primary commodity, artificially deflating the prebiotic's footprint. In practice, many manufacturers cherry‑pick favorable LCA scenarios that align with marketing narratives, rendering the purported superiority of XOS or FOS questionable at best. The logistics equation is equally problematic: even when sea freight is employed, the “last‑mile” distribution often reverts to diesel‑powered trucks, eroding the claimed benefits. Bottom line: without a rigorous, harmonized LCA framework that incorporates full supply‑chain dynamism, the sustainability claims remain speculative at best.
jeff lamore
September 2, 2025 AT 17:23I appreciate the thorough analysis presented here and would like to add a few practical observations. From a consumer standpoint, the availability of bulk, recyclable packaging varies significantly across regions, and many retailers still stock single‑serve formats due to perceived convenience. It would be beneficial for manufacturers to partner with distributors to increase the visibility of larger, more sustainable formats. Additionally, clear labeling of the energy mix used in processing plants helps consumers differentiate between truly low‑impact products and those that simply claim low emissions. Finally, encouraging customers to share their own packaging‑reduction successes can create a community‑driven momentum toward greener choices.
Kris cree9
September 2, 2025 AT 17:36This is total bs i cant even 😤